

Reports
The Reports tab shows the sales activity your role has permission to see. For box office staff, that’s the store’s own performance. For POS managers, it’s the whole store, plus daily and ticket breakdowns.
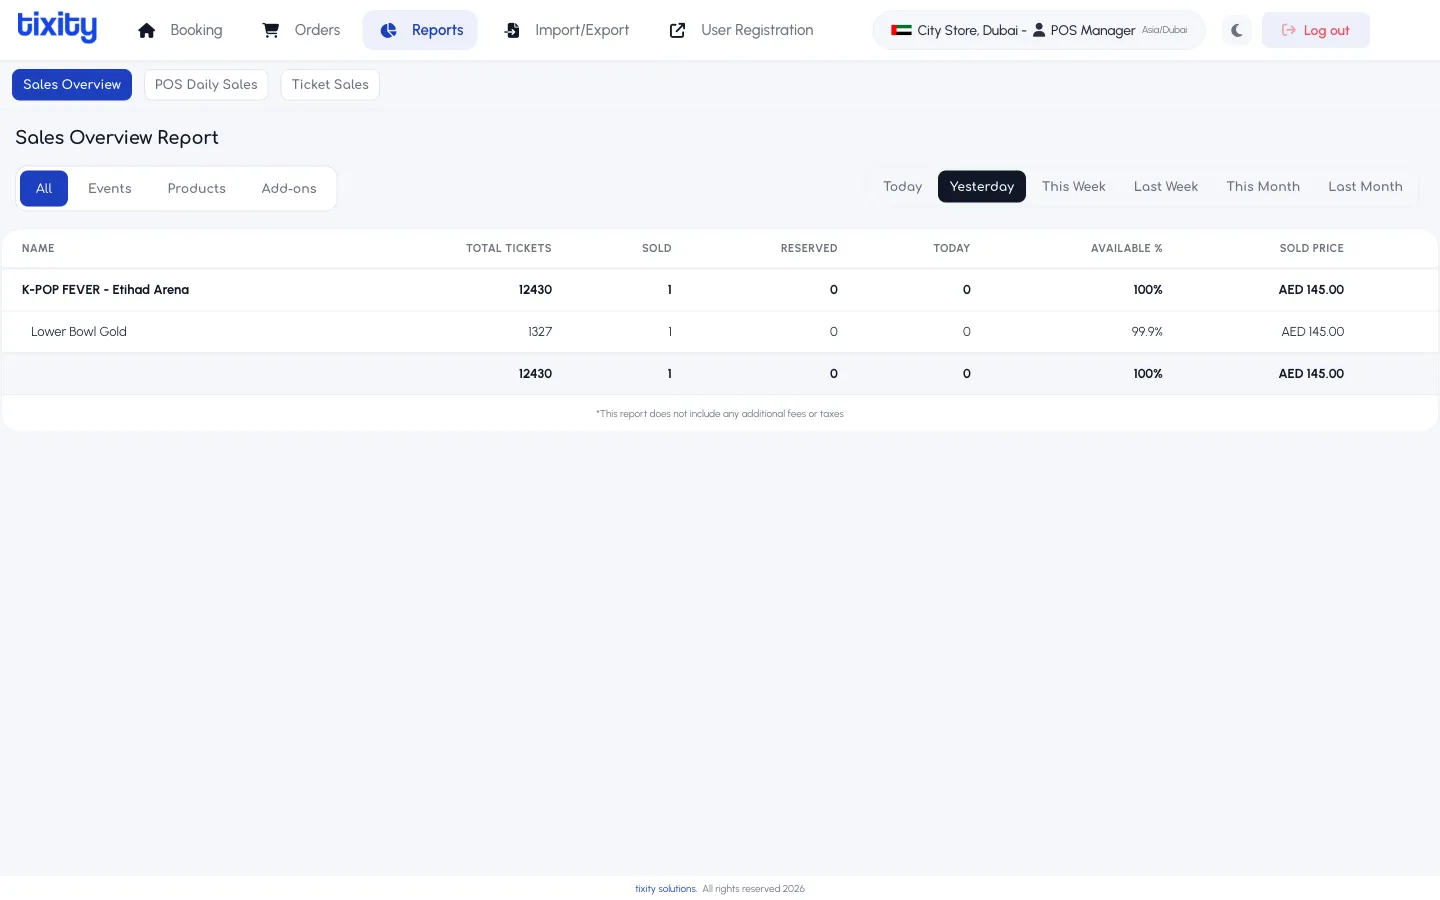
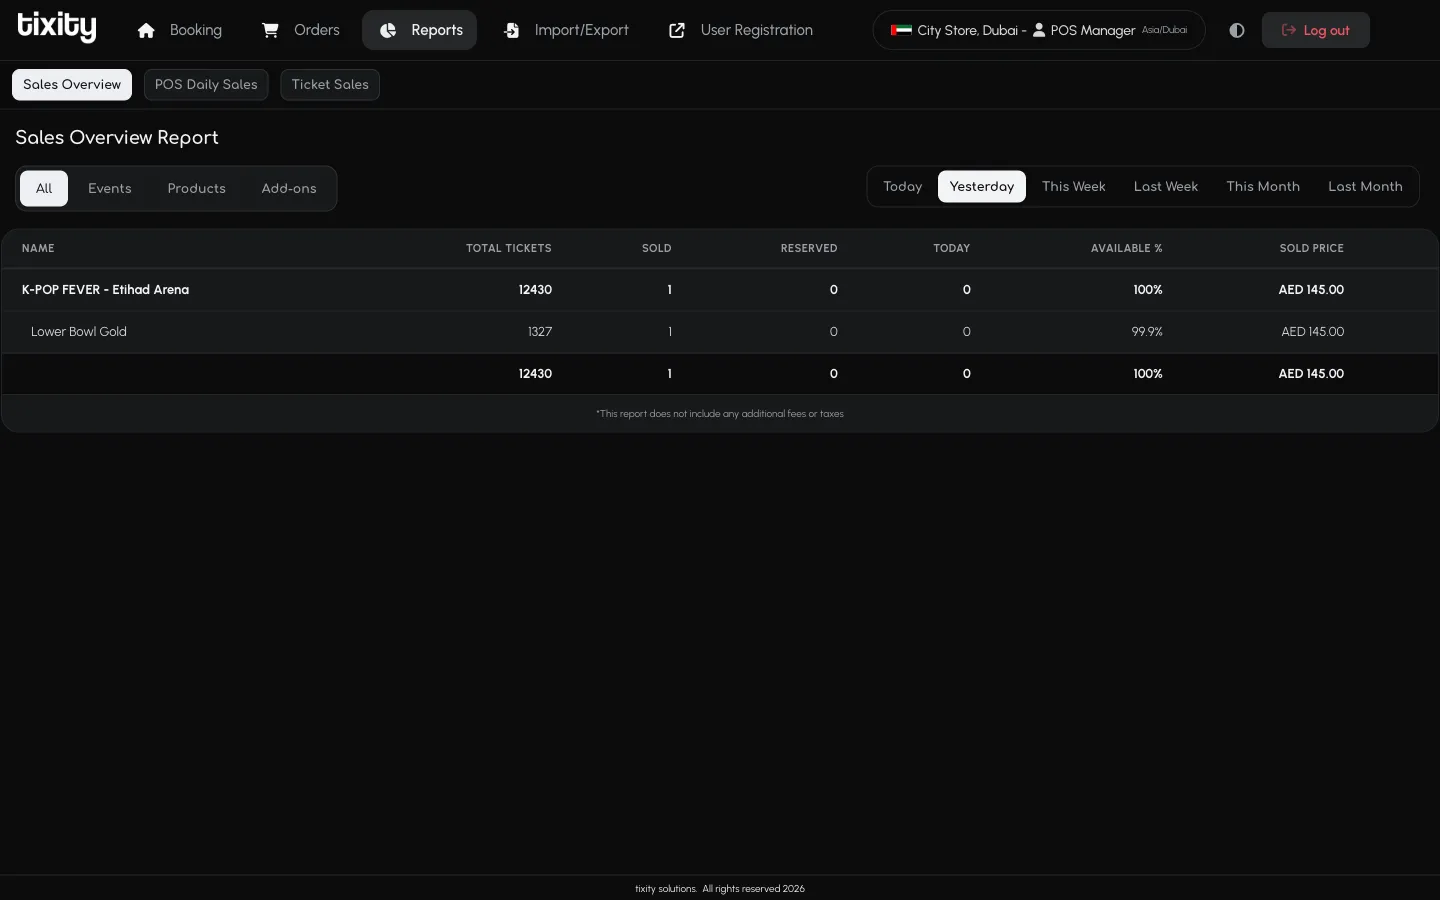
The three reports
Three pills at the top switch between reports.
| pill | what it covers |
|---|---|
| Sales Overview | Revenue, tickets sold, and add-ons for a chosen date range |
| POS Daily Sales | Sales taken through this POS, grouped by day and operator |
| Ticket Sales | Per-ticket breakdown for reconciliation |
Which pills appear depends on your role. If a pill is missing, your account manager can adjust your permissions.
Sales Overview
Sales Overview is the default view. It answers “how much did we sell, and on what?”
Category pills
Under the report title, four pills switch what you’re looking at.
- All — everything (tickets + add-ons)
- Events — ticket sales grouped by event
- Products — merchandise and other product lines
- Add-ons — food, parking, hotel, and similar extras
Date range presets
The presets on the right cover the ranges you’ll actually use.
| preset | range |
|---|---|
| Today | Since midnight in your store’s timezone |
| Yesterday | The full previous day |
| This Week | Monday to today |
| Last Week | The previous Monday to Sunday |
| This Month | 1st to today |
| Last Month | The full previous month |
Click a preset to load. The report re-runs immediately.
Reading the table
Each row is one event (or product, or add-on, depending on the pill you picked).
| column | meaning |
|---|---|
| Name | The event, product, or add-on |
| Total Tickets | Inventory in the current filter |
| Sold | Tickets already sold in the selected range |
| Reserved | Tickets held but not yet paid for |
| Today | Sales taken so far today (regardless of the range preset) |
| Available % | Remaining inventory as a percentage of total |
| Sold Price | Revenue generated by the sold tickets |
A footnote at the bottom, *The report does not include any additional fees or taxes, is a reminder that these numbers are the ticket revenue only, not what actually hit the bank. If no data matches, the report shows No sales data available. Please change your search criteria., that’s normal outside opening hours or on days with no sales.
POS Daily Sales
Daily Sales is the shift-close view. It shows every sale taken through the POS today, grouped so you can hand off cleanly to the next operator.
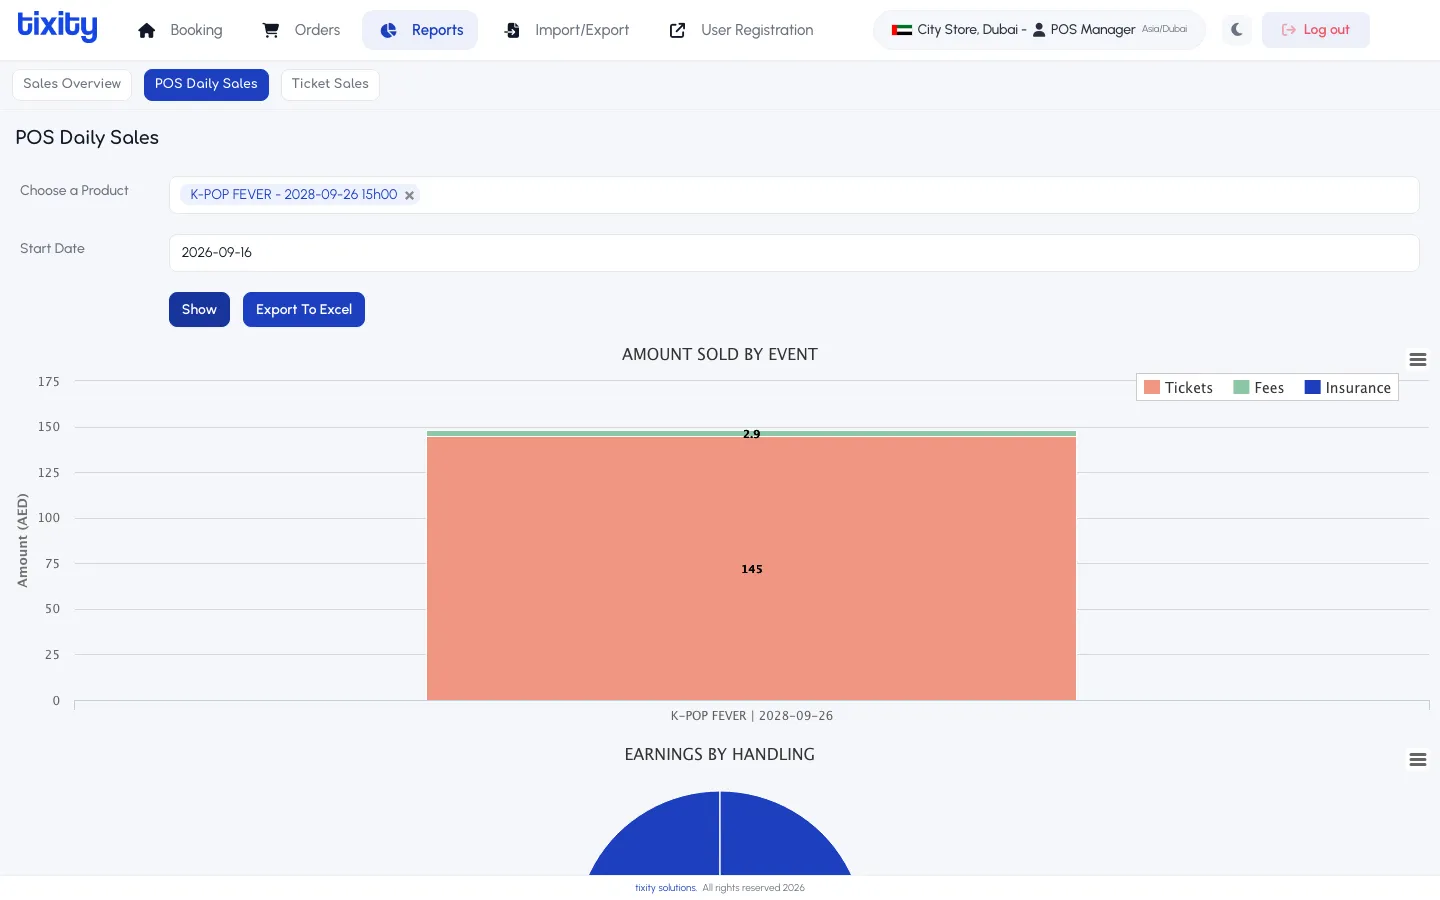
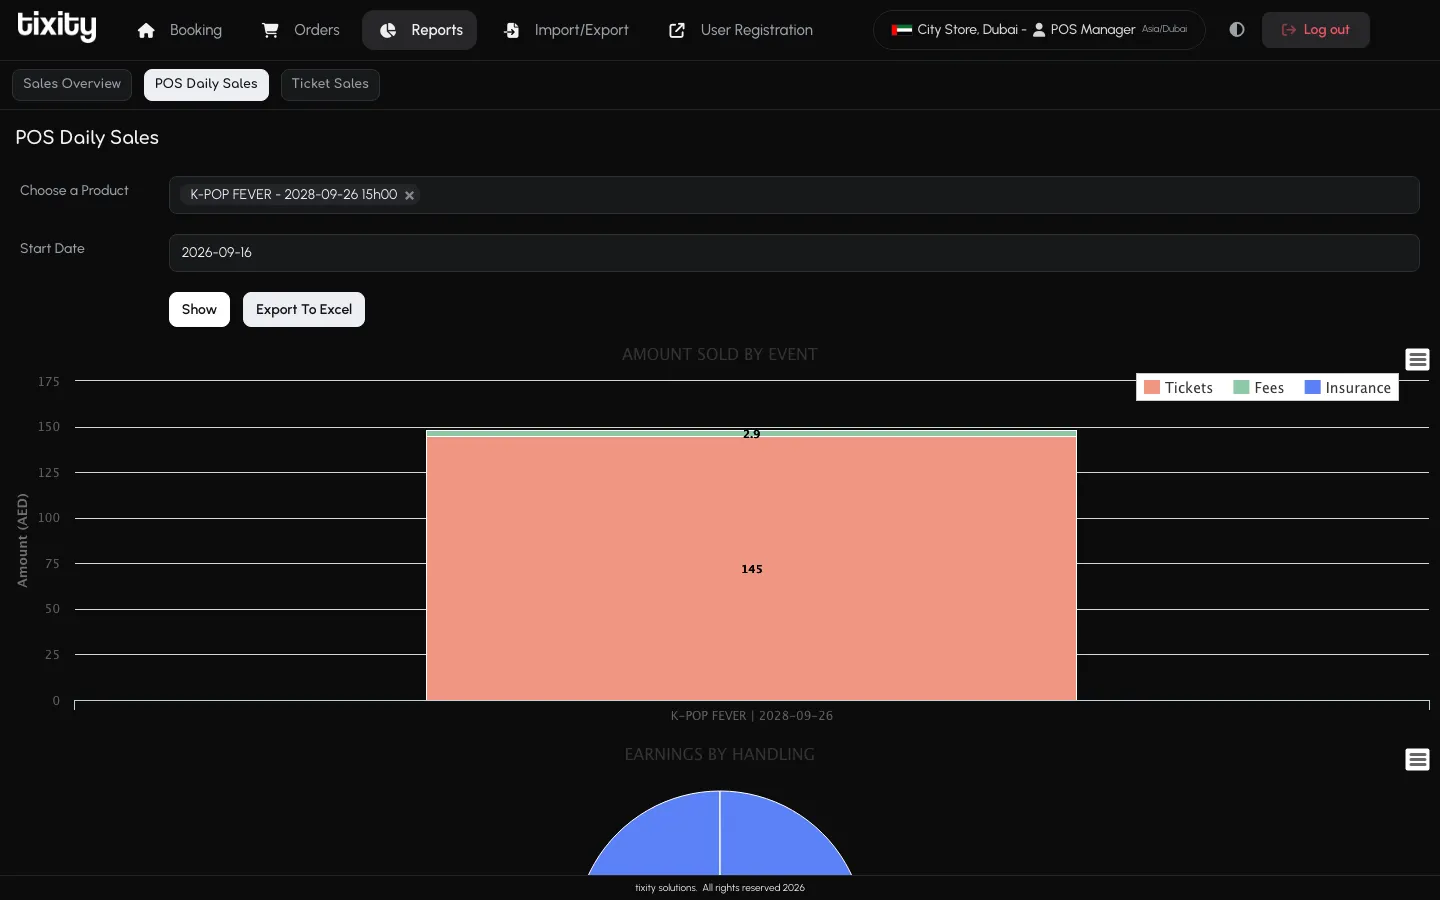
The filters
Two inputs sit at the top of the report.
| field | how to use it |
|---|---|
| Choose a Product | A search dropdown of every performance you’ve had activity for. Pick one or more, they appear as blue chips you can remove with the × |
| Start Date | The day the report covers. Defaults to today |
Click Show to run. Export To Excel downloads the same data as an .xlsx file, use this for handovers to accounts.
The charts
Once you click Show, the report renders four visualisations stacked down the page.
| chart | what it tells you |
|---|---|
| Amount Sold by Event | A stacked bar of ticket revenue, fees, and insurance per event. Handy for spotting whether fees or insurance are pulling their weight |
| Earnings by Handling | A pie chart split by handling type (courier, e-ticket, box office collect), so you know where the physical fulfilment work sits |
| Tickets Sold by POS User | A pie chart of who sold what. Useful for shift performance and for confirming that a specific operator’s cash matches their sales |
| Hourly Sales | A pie chart of when in the day the sales happened, the easiest way to justify staffing at particular times |
Each chart has a menu icon (≡) in its top-right corner. Click it to save the chart as an image or download the underlying data separately from the main Export.
Use POS Daily Sales to:
- Reconcile the cash drawer at the end of a shift.
- Check that every payment method you expected to see is there.
- Spot voids and refunds without having to hunt through Orders.
Ticket Sales
Ticket Sales lists every ticket, one row per seat, rather than one row per order. It’s the report to pull when you need to answer “who bought seat K-23?” or generate a manifest.
Reading the numbers
- All amounts are in the store’s currency (visible in the header chip).
- VAT-inclusive prices are shown by default. Look for the small
incl. VATmarker if you need the breakdown. - Refunded tickets are excluded from revenue totals but still show in ticket counts.
Tip: Reports load client-side against a live query. If a date range covers a long period, expect a few seconds’ delay. If you need the same report daily, ask your account manager to schedule an automated export instead.