

Introduction
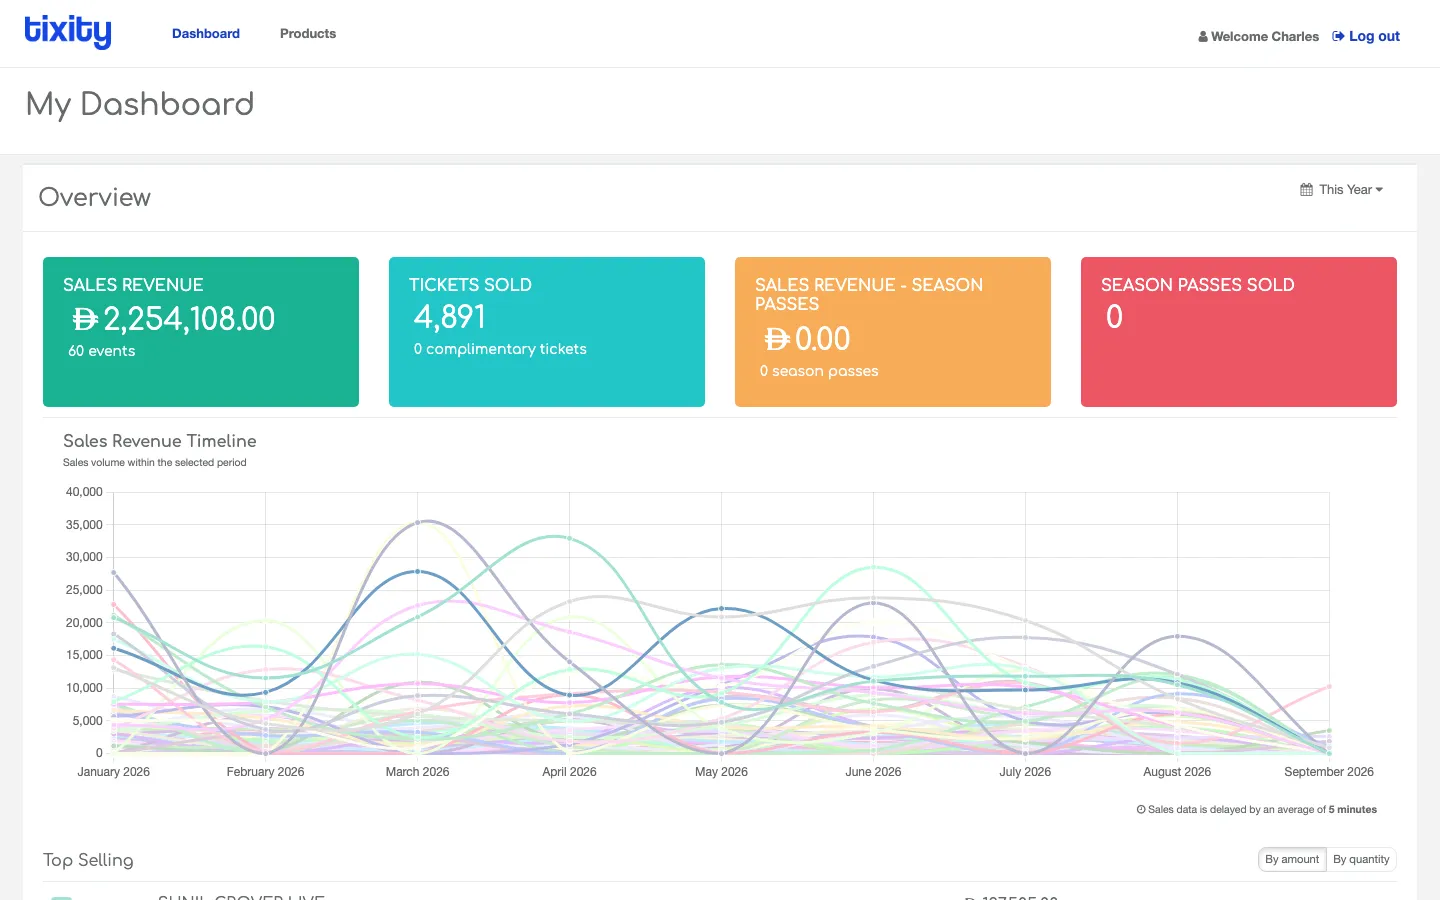
The tixity Dashboard is where organisers, box office managers, and accounts staff track how their events are actually doing. It’s the source of truth for revenue, ticket sales, scan rates, and demographics, whether you’re checking a single upcoming show or looking at your whole catalogue at a glance.
Who this guide is for
Anyone who needs to understand their events, not sell them. If you’re running the box office, see the POS guide instead.
What you can do
The Dashboard is split into three main areas, plus an optional Products view for merchandise and add-ons.
| area | what it’s for |
|---|---|
| Home | Account-wide view: sales revenue, tickets sold, timeline chart, top-selling list |
| Events | Every event you’ve published, split into Upcoming, Past, Season Passes |
| Event detail | Everything about a single event, with tabs for Overview, Breakdown, Add-ons, Attendees, Accounting, Analytics |
| Products | The same overview and listing, scoped to merchandise and add-ons |
Interface overview
The Dashboard uses a single top nav.
- Dashboard — the home / overview view
- Products — the products-only version of home (only visible if products or add-ons are enabled for your account)
- Welcome [name] — the operator on shift, with a Log out link
Every page respects the same date-range picker convention: click the little calendar in the top-right of any card and pick a preset (Today, Yesterday, Last 7 Days, Last 30 Days, This Month, Last Month, This Year, Last Year, Custom Range) or a range specific to that view (event pages also expose All Time and Past Year).
In this guide
- Getting started — signing in and understanding the layout
- Home — overview widgets, timeline chart, and top-selling
- Events — listing, filters, and drilling into an event
- Event overview — headline numbers, Gross Sales Timeline, purchase sources
- Event breakdown — per-category performance
- Event add-ons — food, parking, and other extras
- Event attendees — demographics and the attendees table
- Event accounting — gross, commission, fees, net
- Event analytics — page views, channels, referrals
- Products — merchandise and add-ons