

Event breakdown
The Breakdown tab is the per-category view of the event. It answers “which price band is selling, and how much is left?”
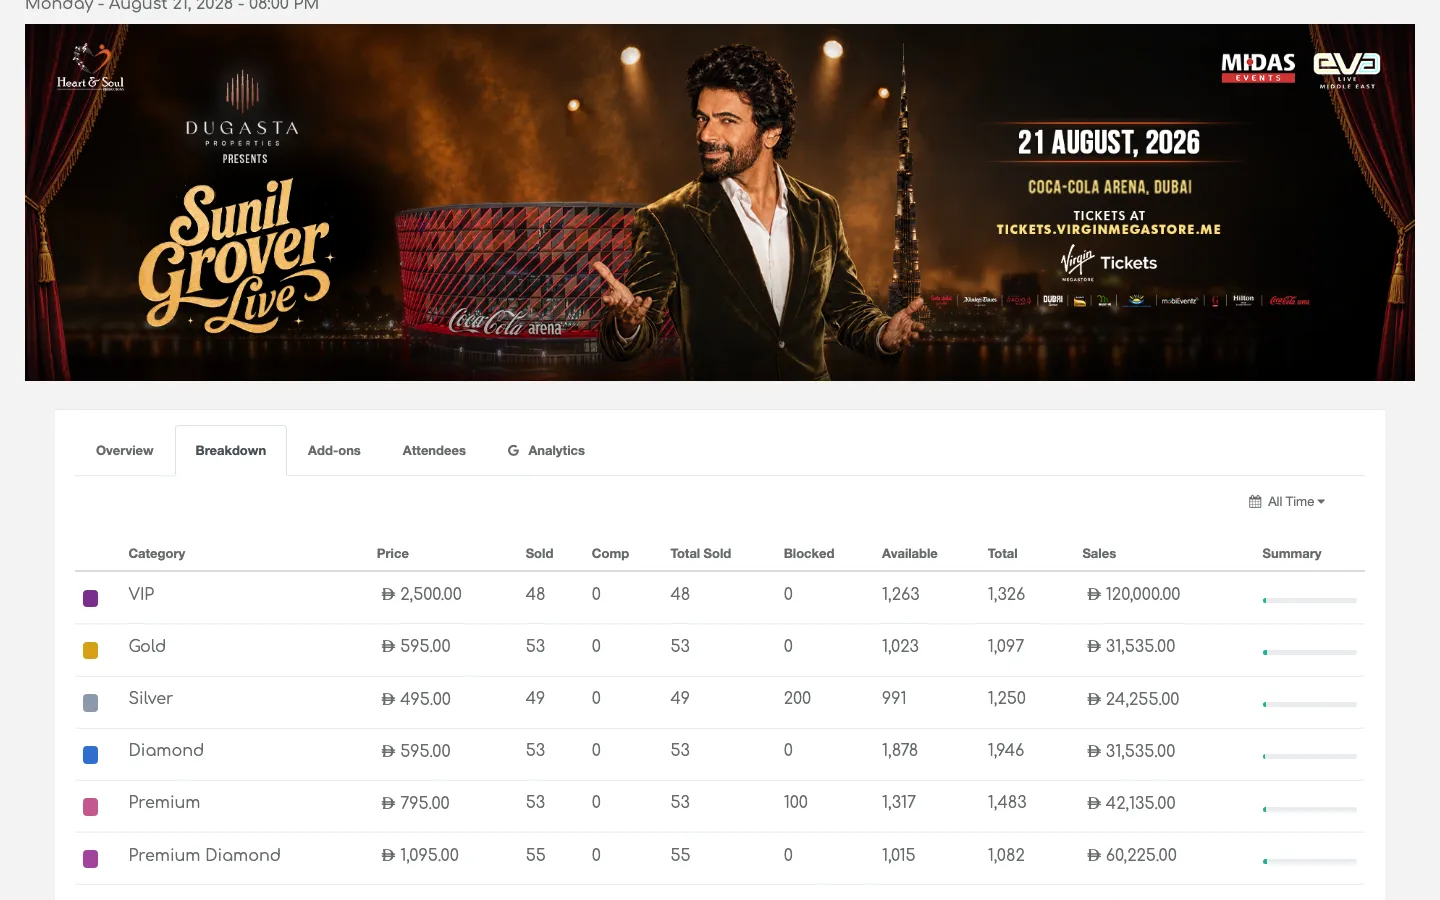
The date range
The picker in the top-right of the tab controls which orders feed the numbers. Presets: Today, Yesterday, Last 7 Days, Last 30 Days, This Month, Last Month, Past Year, All Time, Custom Range. Use All Time for the definitive lifetime view.
Reading the table
Each row is one ticket category. From left to right:
| column | meaning |
|---|---|
| Colour swatch | The category’s colour on the seat map |
| Category | Category name (e.g. VIP, Gold, Silver, Diamond, Premium, Premium Diamond) |
| Price | Face value per ticket |
| Sold | Tickets sold for that category in the selected range |
| Comp | Complimentary tickets issued for that category |
| Total Sold | Sold + Comp |
| Blocked | Seats blocked out of sale (holds, obstructed views, house seats) |
| Available | Seats still open for sale |
| Total | Category capacity |
| Sales | Revenue for that category in the range |
| Summary | A visual bar for a quick sold-to-capacity read |
The final row is the totals across every category.
Sales by category chart
Below the table, a Sales by Category doughnut chart puts the revenue split in visual form. Handy for a slide to send upstream, “look, 60% of revenue is coming from VIP and Diamond.”
Common workflows
- Deciding whether to release blocks — sort by Available, ascending, and look for categories that are nearly sold out with blocked stock you could release.
- Setting a price rise — if a category is selling out fast, that’s your candidate.
- Reconciling with the seat map — the colour swatch here matches the category colours you see in the Seatmap Designer, so a quick eyeball check catches misconfigurations.
Tip: The Breakdown table is per-performance. For multi-show runs, use the “ALL SHOWS” selector above the tabs to see the roll-up across every night.