

Getting started
Signing in
Open your Dashboard URL in any modern browser and enter the credentials issued by your tixity account manager. Your session stays active while the tab is open.
The header
The top nav is deliberately minimal, one link per section, and your identity on the right.
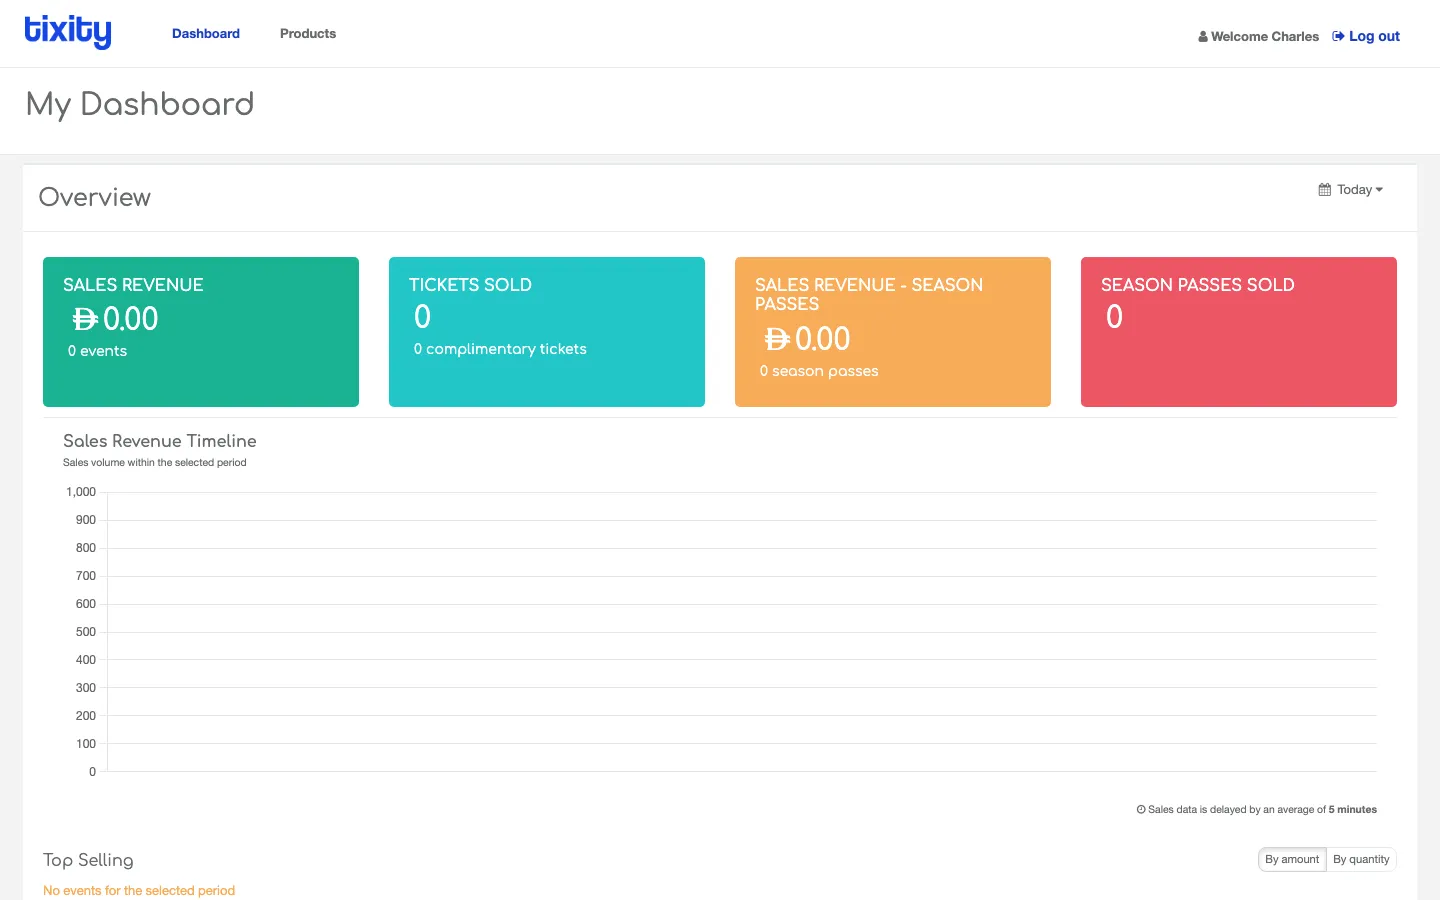
| item | what it does |
|---|---|
| Dashboard | Account-wide home: overview widgets, revenue timeline, top selling |
| Products | Products-only version of the home page (only shows if merchandise or add-ons are enabled) |
| Welcome [name] | The user on shift |
| Log out | Ends your session |
Two mental models
Everything on the Dashboard is either account-wide (across every event) or event-specific (drilled into one show).
- The Home and Products pages are account-wide. The date-range filter changes which orders they count.
- A single event page is event-specific. Widgets for total tickets, income, and complimentary are cumulative. Only the Gross Sales Timeline and the Breakdown table respect the date filter.
Getting comfortable with this distinction saves a lot of “why is revenue different here?” head-scratching.
Before your first look
- Set the date range on the home Overview to the period you actually care about. Today is the default, but organisers usually want This Year or a specific month.
- If a widget is blank, check the range first, then the tab. Empty state is almost always a filter, not missing data.
Tip: All the numbers in the Dashboard have a small delay. The footer of the Sales Revenue Timeline says
Sales data is delayed by an average of 5 minutes, keep that in mind when reconciling against POS terminals in real time.