

Event overview
Opening an event lands you on the Overview tab. This is the “how’s it doing” view: cumulative sales, today’s sales, complimentary and blocked stock, the sales curve, and where the tickets are coming from.
The header
Every event page has the same header:
- Event name with a preview link (
⤴) that opens the public storefront page in a new tab. - Performance date and time underneath.
- Event banner if one is uploaded, either the storefront hero or a promotional image.
- If the event is part of a run, an “ALL SHOWS” dropdown appears above the tabs so you can flip between individual performances or view the roll-up.
The tab bar
Below the header:
| tab | covers |
|---|---|
| Overview | This page |
| Breakdown | Per-category performance |
| Add-ons | Food, parking, and other extras |
| Attendees | Demographics and the attendees table |
| Accounting | Gross, commission, fees, net (role-gated) |
| Analytics | Storefront traffic (role-gated) |
The top row of widgets
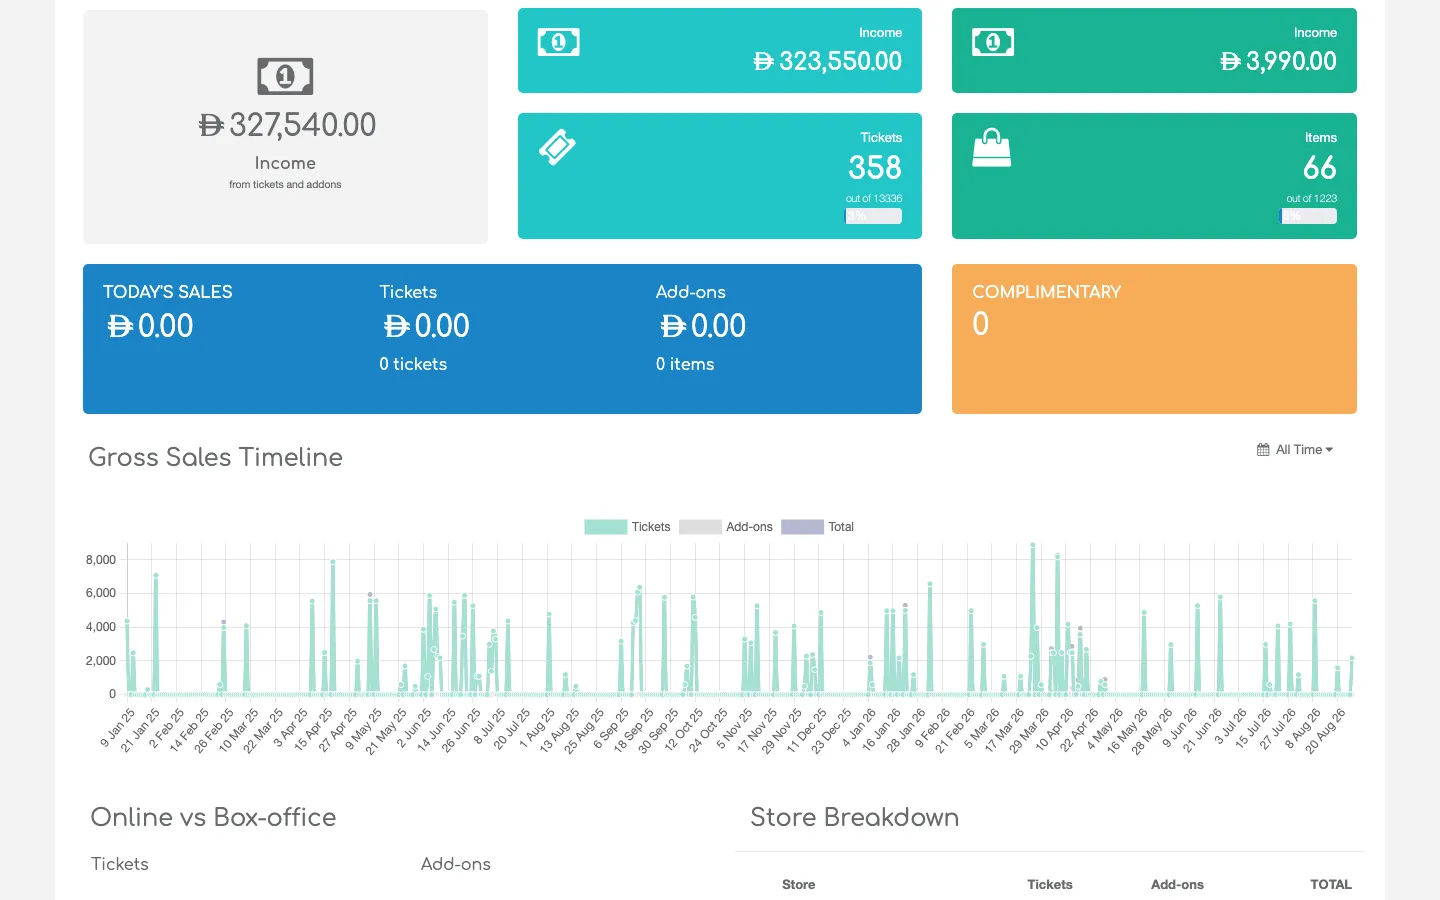
Depending on whether the event has add-ons, you’ll see either a wide Income widget or three grouped widgets:
- Event Sales — total gross income across tickets and add-ons for this event
- Tickets — ticket-only revenue plus the number of tickets sold with a
out ofcapacity count and progress bar - Add-ons — add-on-only revenue plus items sold with the same
out offraming
These widgets are cumulative, they show the lifetime total for the event and do not respond to the date filter.
The second row
- TODAY’S SALES — a blue tile broken into columns for today’s revenue, ticket sales, and add-on sales
- COMPLIMENTARY — a yellow tile with the total number of comps issued
- BLOCKED — appears next to Complimentary if any seats are blocked
Gross Sales Timeline
Below the widgets, the Gross Sales Timeline plots sales over time. The date-range picker in the top-right of this chart controls its window only, the widgets above stay cumulative.
Event-page presets: Today, Yesterday, Last 7 Days, Last 30 Days, This Month, Last Month, Past Year, All Time, Custom Range. Use All Time to see the entire sales history from launch to today.
Full view: Online vs Box-office and Store Breakdown
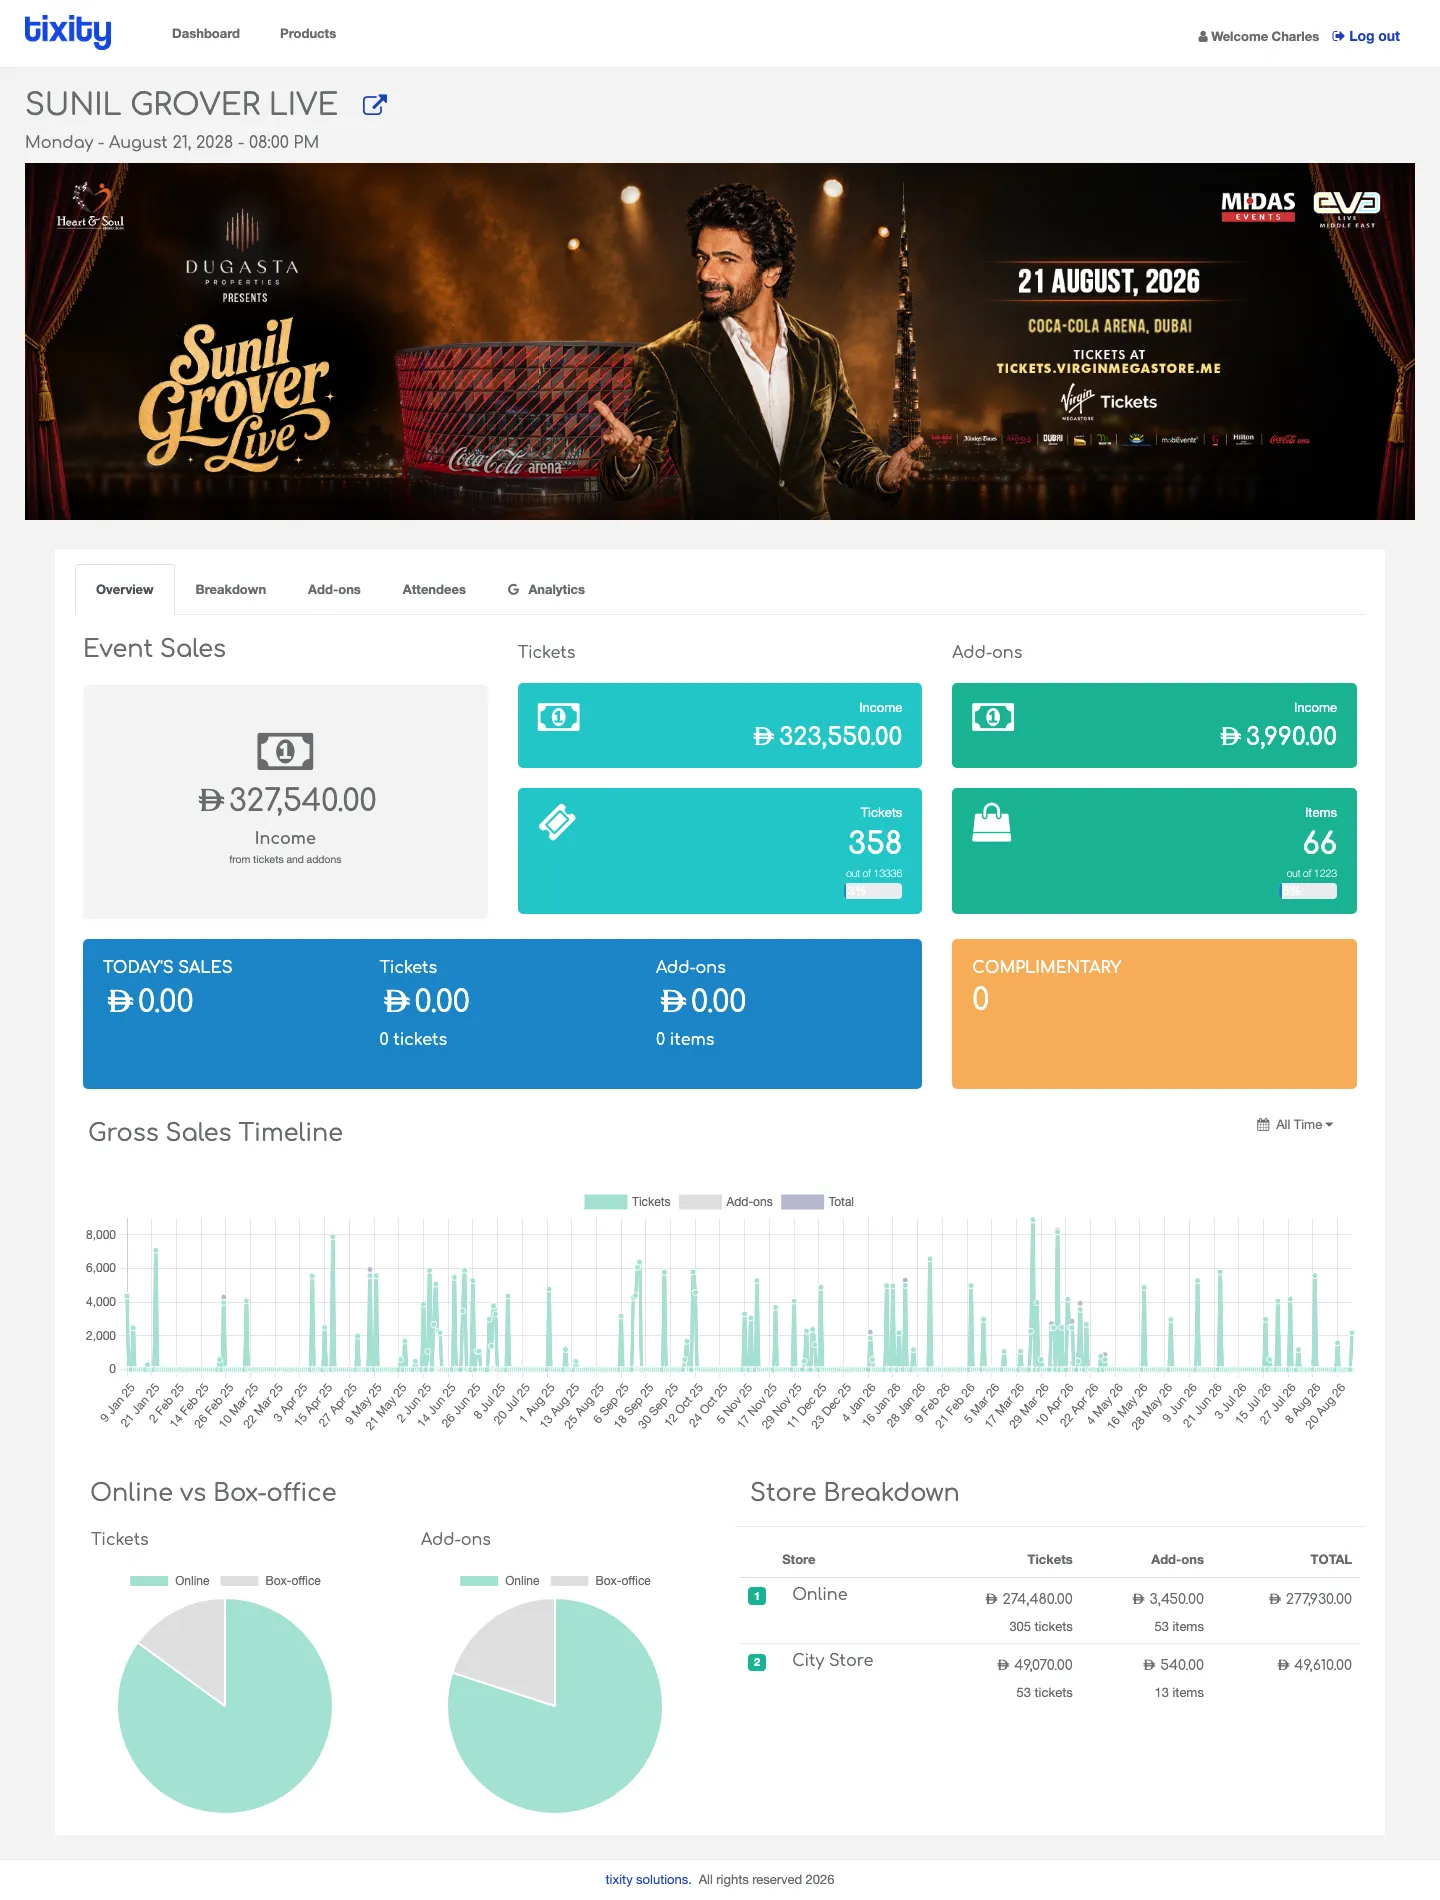
Scroll down and two panels appear side by side:
- Online vs Box-office — two pie charts (one for tickets, one for add-ons) that split sales into online and physical sales channels. Handy for deciding where to focus marketing.
- Store Breakdown — a table listing each sales channel (Online, City Store, and any other configured stores) with tickets, add-ons, and total revenue. This is where you’d check that a specific box office is pulling its weight.
CHECKED-IN
Once the event has started scanning, a red widget appears with the number of tickets scanned in, out of the tickets to check. For an event with add-ons, this widget splits into three columns: overall, tickets only, and add-ons only.
Tip: The Overview tab is deliberately read-only, no exports, no filters that change the top widgets. If you need to slice or export data, jump to Breakdown or Attendees.