

Event analytics
The Analytics tab is a storefront-side view: how many people looked at the event page, where they came from, and what device they were on.
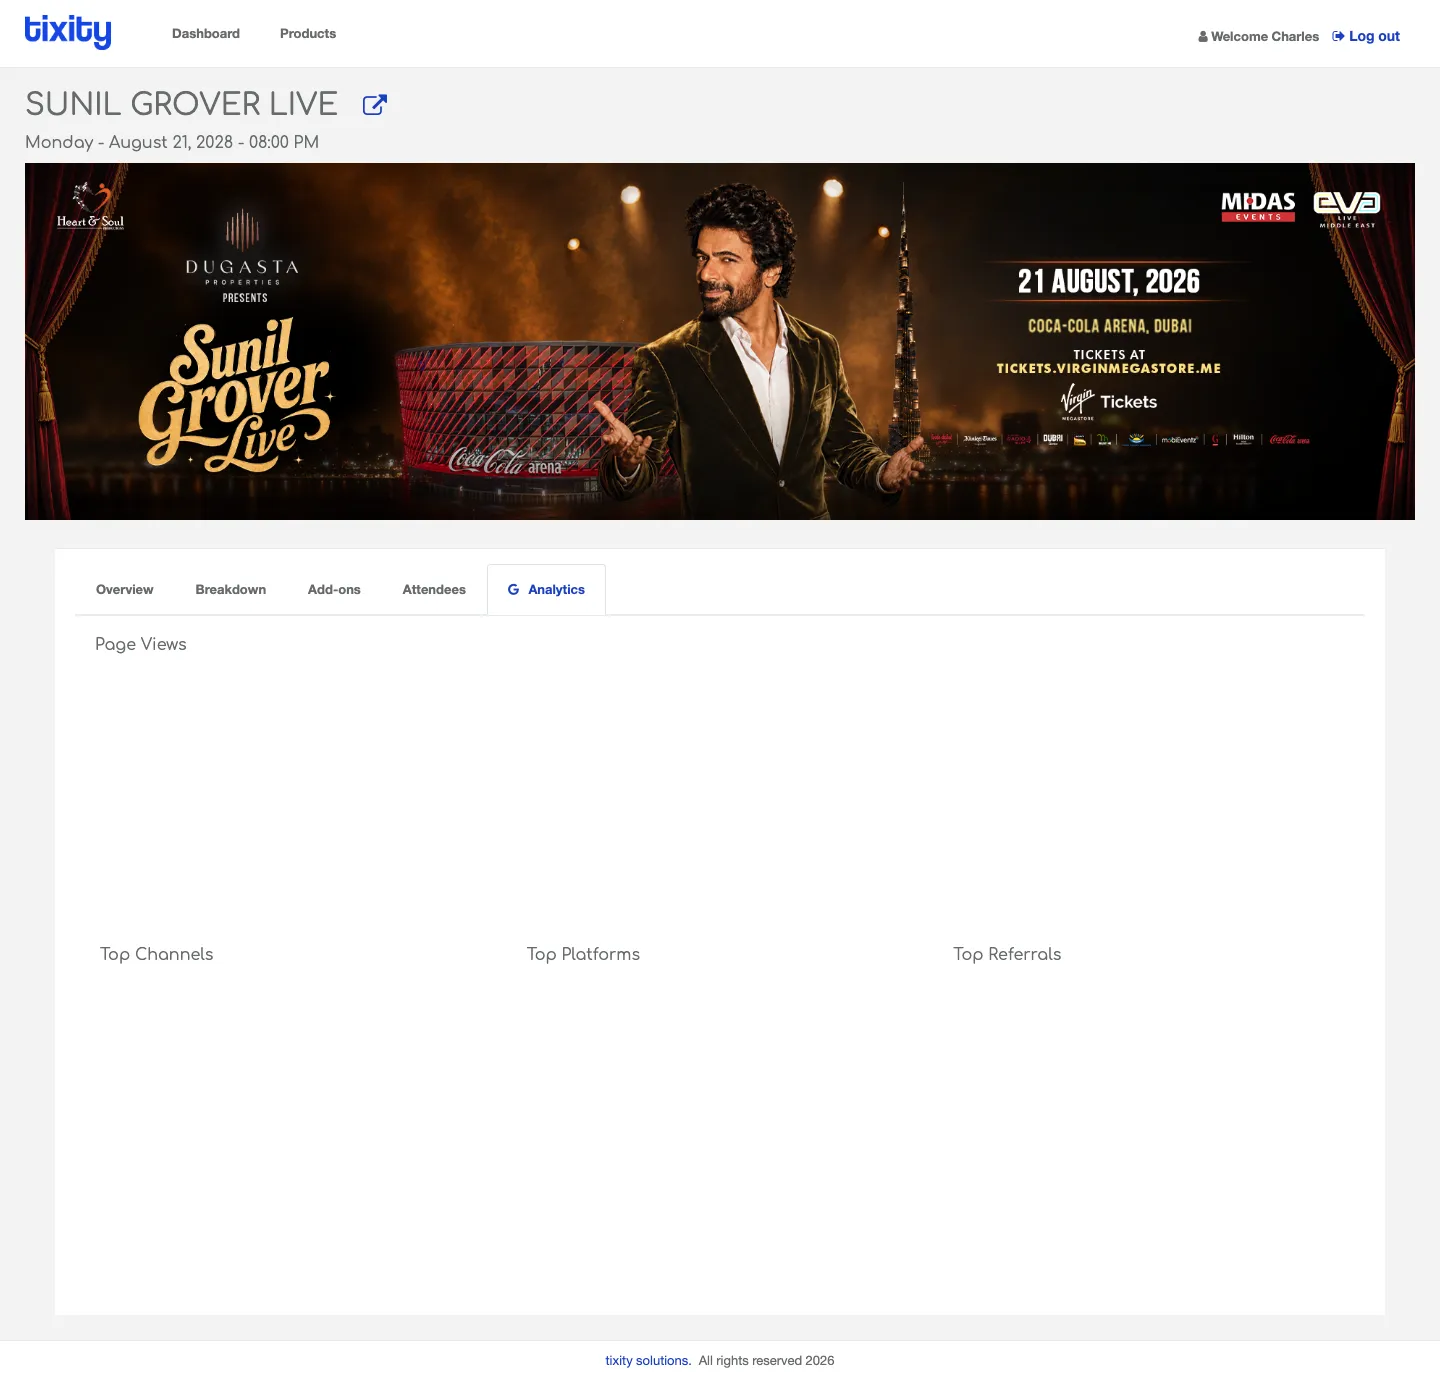
Like Accounting, this tab is role-gated and requires Google Analytics integration on your tixity storefront. If it’s blank or missing, your storefront isn’t wired to a GA property, ask your account manager to set it up.
The four widgets
| chart | shows |
|---|---|
| Page Views | Line chart of unique views to the event page over the last period |
| Top Channels | Doughnut split by traffic source category: Direct, Organic Search, Social, Referral, Paid |
| Top Platforms | Doughnut split by device / OS: mobile web, desktop, iOS app, Android app |
| Top Referrals | Doughnut ranked by the specific referring domain (Instagram, TikTok, an affiliate site, a partner blog) |
For multi-performance runs, a small footnote reminds you that *Analytics data is presented for the main event (all shows), individual sub-events don’t have their own analytics stream.
What to look for
- A spike in Page Views without a matching spike in Sold on the Overview → traffic is arriving but not converting. Usually a pricing issue, a storefront bug, or a mismatched creative.
- A referral you didn’t budget for in Top Referrals → someone’s promoting your event organically, worth thanking them or building on it.
- Mobile share above 80% in Top Platforms → invest in the mobile storefront experience before the desktop one.
Tip: Analytics figures update on a daily schedule (Google Analytics processing delay), so today’s numbers won’t be final until tomorrow. Sales figures in the other tabs run near-real-time (five-minute delay), the two views are on different clocks.