

Reports
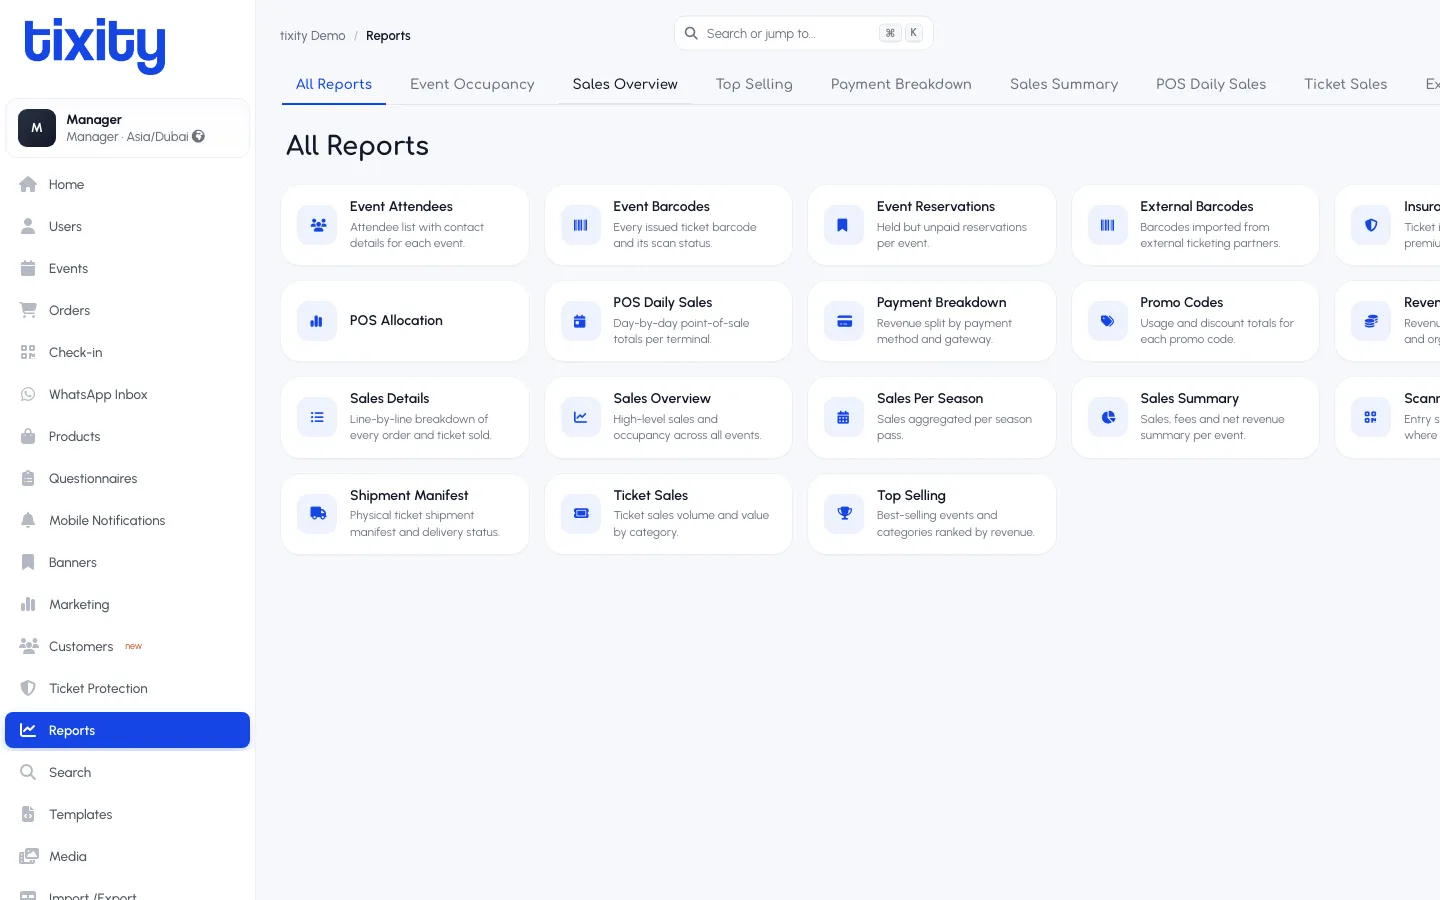
Admin’s Reports section is the full catalogue, everything the platform can generate. The POS Reports tab shows a role-filtered subset (Sales Overview, POS Daily Sales, Ticket Sales). Here, an Accountant or Organiser sees them all.
The tab bar
Across the top, tabs group reports into families:
| tab | contents |
|---|---|
| All Reports | Every report you have access to, on one page (the default view) |
| Event Occupancy | Capacity vs sold, per event and per category |
| Sales Overview | High-level revenue and ticket counts |
| Top Selling | Ranking of best-performing events, categories, and add-ons |
| Payment Breakdown | Revenue split by payment method and gateway |
| Sales Summary | Organiser-level revenue summary |
| POS Daily Sales | Day-by-day POS totals per terminal |
| Ticket Sales | Volume and value by category |
| External Barcodes | Barcodes imported from external ticketing partners |
The report cards
All Reports is a card grid of every available report. Each card has an icon, a name, and a one-line description of what it covers. Click any card to open its parameter form (date range, event filters, country, currency), then run.
Recognisable ones from POS + Dashboard:
- Event Attendees — attendee list with contact details for each event
- Event Barcodes — every issued ticket barcode with its scan status
- Event Reservations — held but unpaid reservations per event
- POS Allocation — how tickets are allocated across POS offices
- POS Daily Sales — as documented in the POS Reports guide
- Payment Breakdown — revenue split by payment method and gateway
- Promo Codes — usage and discount totals per code
- Sales Details — line-by-line breakdown of every order and ticket sold
- Sales Overview — high-level sales and occupancy across every event
- Sales Per Season — sales aggregated per season pass
- Sales Summary — sales, fees, and net revenue summary per event
- Shipment Manifest — physical ticket shipment manifest and delivery status
- Ticket Sales — ticket sales volume and value by category
- Top Selling — best-selling events and categories ranked by revenue
Some reports (Insurance, Revenue by Country, Scanner Usage, Season Pass Utilisation) only appear when the relevant plug-in is enabled for your account.
Running a report
- Click a card.
- Fill the parameter form. Every report asks for a date range; some also ask for a country, an event, a POS office, or a specific season.
- Click Show (or the equivalent primary button).
- The report renders on the same page. Most reports have an Export to Excel button.
Exports and scheduled deliveries
For recurring reports (daily sales to accounts, weekly attendance to venue partners), ask your account manager to configure a scheduled export. Scheduled exports run overnight and email the file to whoever needs it, no operator has to remember to click Show every morning.
For one-off exports, use the Export to Excel button after running the report.
Tip: Reports run against a live query. Wide date ranges on large accounts can take tens of seconds; if a report is timing out, narrow the date range or export a smaller slice and stitch them together.